Showing posts with label information design. Show all posts

Friday, April 22, 2011

The Beauty of Diagrams

BBC documentary spotlighting key diagrams through history. But this show about graphic representation isn't narrated by an artist or a designer, but the mathematician Marcus du Sautoy.

In this programme he looks at the visualisation of mathematical data, and in this case how something which may be seen as quite theoretical can give rise to an iconic diagram which fired the imagination of the public. It's not that the science behind the DNA was uninteresting but, as du Sautoy claims, the visualisation of the double helix has immediate appeal ("an attractive, marketable shape"). It was Crick's classically trained artist wife who translated the original diagram into the now famous diagram which first appeared in Nature magazine in 1953 and unwittingly led to a globally recognised and also commercialised diagram. In this process du Sautoy asks: does it enhance the understanding or, with its iconic status does it leave a vague idea of the 'essence' of life on us. Do we know what it really means? Or do we not even see past the structure...this DNA diagram illustrates 'life'. Is it overused? Is it over sold?


Programme was first shown on BBC Four, 8:30PM Thu, 16 Dec 2010.

It's also worth checking out du Sautoy's visually engaging (if annoyingly noisy) website too:

Sunday, March 27, 2011

Signage at Duxford

With new printing technology comes the ability to make large format, graphics-rich signage and IWM Duxford's new system is a fine example of this.

Below is the welcome sign which greets you at the main entry near the gift shop. This gives an instant overview without being overwhelming, I find. They've used military colours without making it feel drab. Love the air force yellow you see as a highlight colour.


Check out the detail here on one of the triangular sectioned markers which are found dotted around: The screws have been painted so as not to jump out too much. At the top of the photo below you see a photo with 'camouflaged' screw head. Neat.

Next iteration: animated/video screen information points!


Friday, August 13, 2010

Data visualisation debate featuring David McCandless and Neville Brody

It's good to see a healthy debate about the current trend of 'making data beautiful', especially on mainstream news programmes such as Newsnight. Highlighted here on the Creative review site, the argument says: is data visualisation an aid or hindrance to understanding.

The debate on Newsnight can be seen here and starts at 26:05.

Of course visualisation of data should aid communication, but for me, McCandless advocates the pretty picture road to infographics to the point where we can't tell what the main idea of the graphic is and needs further voice off explanation! I'm happy to report Brody was skeptical of the sorts of graphics McCandless creates and furthermore managed to plug his Anti-Design festival on 18-26.09.10. Something McCandless will no doubt find very unpretty.

More rants on infocrapics here, and here.


Friday, June 25, 2010

Infographics should portray information

I was listening to Radio 4 today and my ears pricked up when I heard they were discussing information design. the programme, More or Less, asked the audience the previous week some questions so that infographic designer David Mcandless could take the data and work on it.

The results are here:

Now I don't deny that what he has done is aesthetically pleasing as I, like him, find data representation or 'information' in its graphic form very interesting. What I find with much of what Mcandless showcases on his blog is that the designers have made the graphics beautiful but have lost some of the impact of the data. Information can be beautiful but I think these designers sometimes work hard to make (or even force) the graphics to be beautiful in a whole different dimension.

Take, for example, the main graphic (What are you doing while listening to More or Less). this graphic seems simple but I find it difficult to pick out more than one or two levels of data. For example I can see where the largest and second largest chunks of activity are but what about fourth, fifth? The 'intensity' label adds more confusion as our eye is drawn to the darker colour and gives it more importance over the others but at the same time biases our analysis. Lying down and handicrafts are the more or less the same size but does handicrafts seem bigger because of the higher contrast?

The merits of this sort of graphic are obvious: a very good snapshot of what people are doing but really I only extract the top four or five and then again with no certainty.

Information design is very important because if style takes precedence over function (that is to say delivering the information to the user in an easily understandable way) then it might as well be a painting of my cat (How many caffe lattes a day does my cat drink? Where does she sit during the day? How little does she care of my existence?).

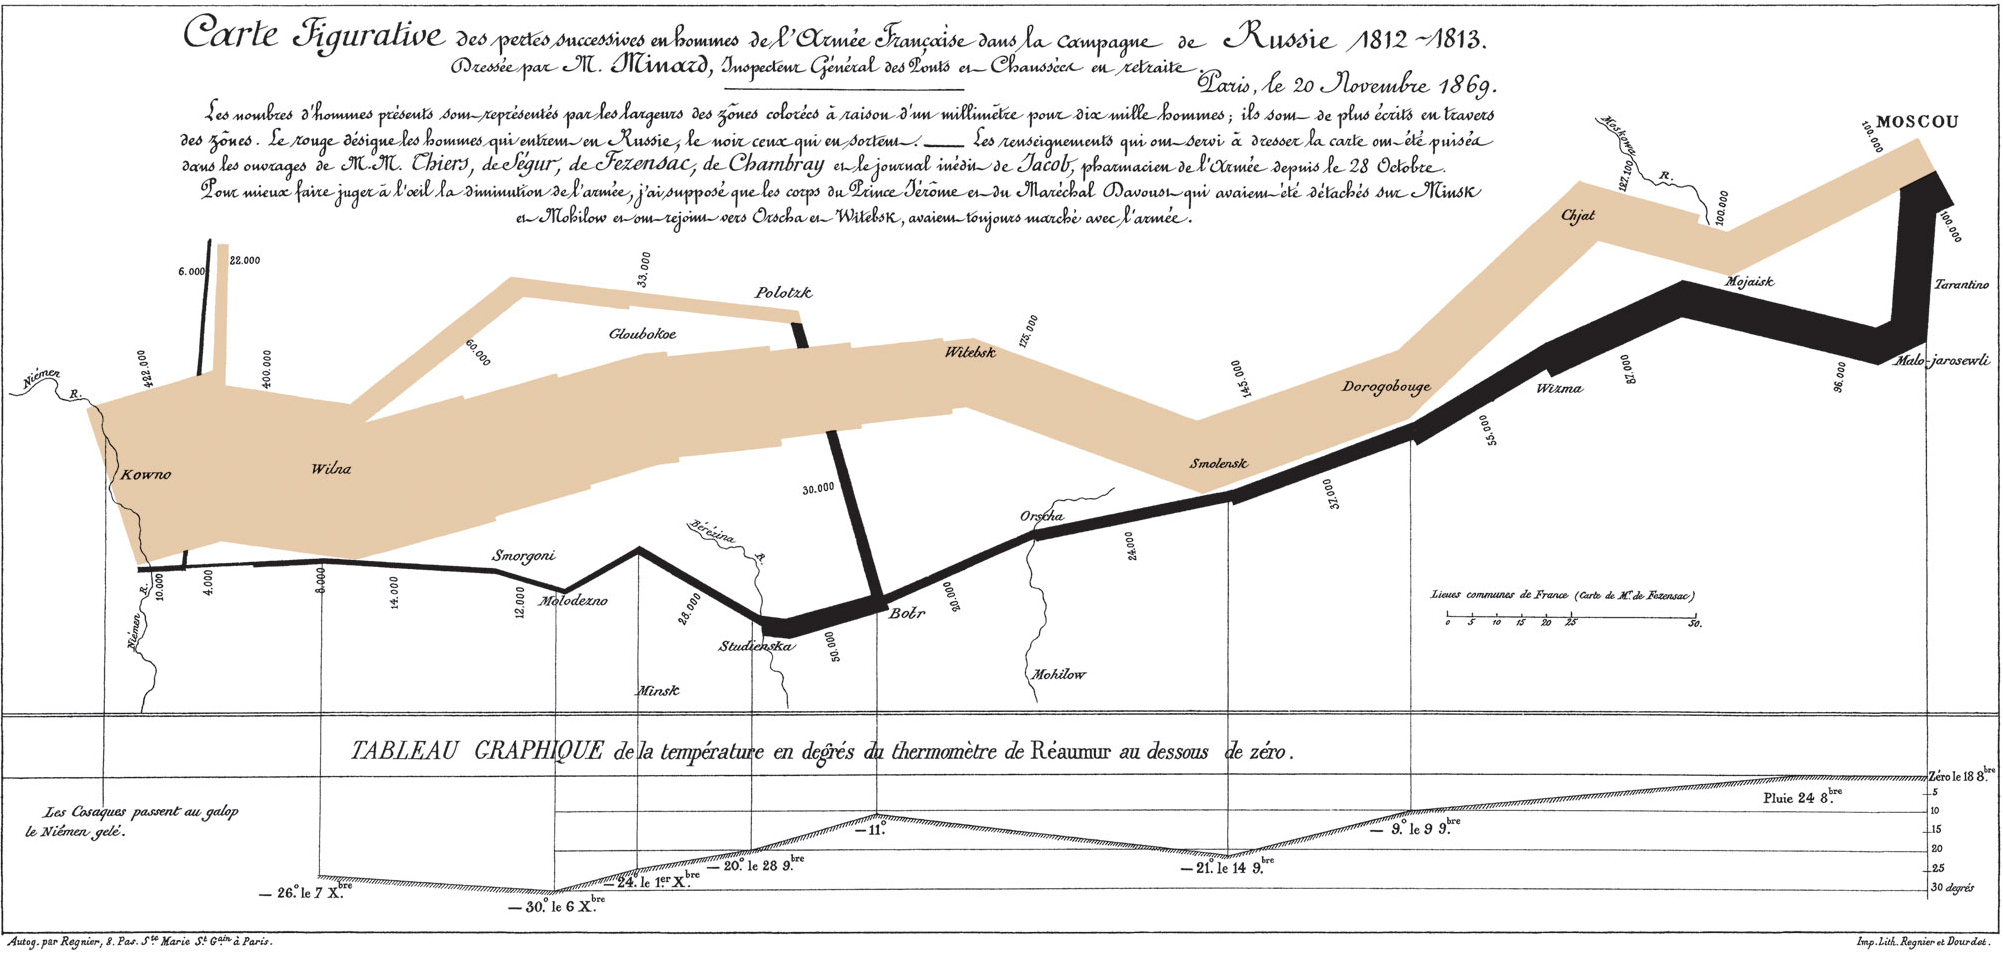
I'd like to end on a well known and pioneering piece of infographics, Charles Minard's graphic showing the decreasing size of the Grande Armée as it marches to Moscow.